Today, the national debt exceeds $18 trillion and is expected to grow as six years of declining federal budget deficits come to an end this year, according to a recent analysis from the Congressional Budget Office (CBO).
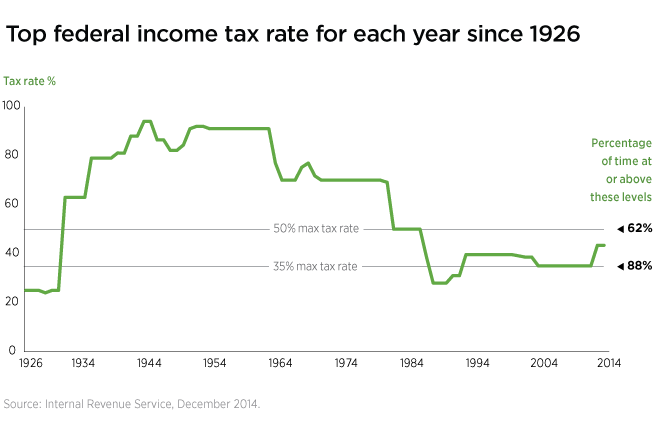
Even with a growing economy, revenues coming into the government’s coffers will not keep pace with spending, especially given significant mandatory expenditures. At the same time, today’s tax rates are significantly lower than 50 years ago. In fact, the highest marginal tax rate has hovered around 35% most of the time since the mid-1980s.
The nation’s debt
The total national debt — money owed by the United States and measured by the value of outstanding Treasury securities — was $18.9 trillion as of January 20, 2016, the Treasury Department reported. The nation’s debt has more than doubled since 2007.
Budget deficit to increase in 2016
The federal budget deficit, which represents the shortfall between government revenue and spending for one year, totaled $439 billion — or 2.5% of GDP — in 2015. This represented the lowest level since 2007 and, in percentage of GDP, was below the average deficit over the past 50 years. Fiscal year 2015 was the sixth straight year that the deficit had declined as a percentage of GDP since it peaked in 2009.
In its January 19, 2016 update, the CBO stated that the deficit will increase for the first time since 2009. The projection is for a $544 billion deficit, representing 2.9% of GDP.
Calendar issue
A portion of the increase — about $43 billion — is due to the timing of the fiscal year on the calendar. In 2016, October 1, which is the first day of fiscal year 2017, falls on a weekend. Certain government payments that would ordinarily be made in fiscal year 2017 will be made on the last day of fiscal year 2016. If it were not for the calendar issue, the 2016 deficit would still increase but would total $500 billion or 2.7% of GDP, the CBO noted.
New legislation
The CBO’s January outlook is $130 billion higher than its August projection of $426 billion. The increase is largely due to bills that became law after August, including the retroactive extension of a number of tax provisions.
The deficit would also cause an increase in the national debt to about 76% of GDP by the end of 2016, reflecting an increase of two percentage points compared with last year, the report noted.
Entitlement programs pose challenges for federal budget
Federal spending is projected to rise by 6% this year, largely due to a nearly 7% increase in mandatory spending, a 3% increase in discretionary spending, and a 14% increase in net interest spending.
A significant portion of mandatory spending is Social Security, which is expected to increase by 3% this year. Other major sources of mandatory program spending include Medicare, Medicaid, the Children’s Health Insurance Program, as well as the cost of health-insurance subsidies, which are expected to be 11% higher in 2016 than in 2015, according to the CBO.
Other pressures on the budget include discretionary spending, where discretionary spending for national defense will increase slightly and non-defense spending will rise 4%. The biggest jump is in net interest spending resulting from the rising-interest-rate environment and the fact that the federal debt is growing.
Revenues to rise
Federal revenues are expected to rise by only 4% in 2016. And CBO projections indicate expenditures will outpace revenue for the next decade.
If current laws remain unchanged, the deficit is expected to grow over the next 10 years, and by 2026 it would be larger than its average over the past 50 years, the CBO stated. The budget deficit is expected to increase modestly through 2018 but then rise more sharply, reaching $1.4 trillion in 2026. As a percentage of GDP, the deficit would climb to about 4.9% by the end of the 10-year period.
Entitlement programs remain challenged
Social Security is the largest single program in the federal budget, the CBO points out. As U.S. life expectancy increases, more and more Americans qualify for benefits. In fiscal year 2015, Social Security benefits totaled nearly one quarter of all federal spending. According to CBO projections, Social Security’s trust funds will be exhausted in 2029. At that point, the result would be a 29% reduction in benefits.
299157